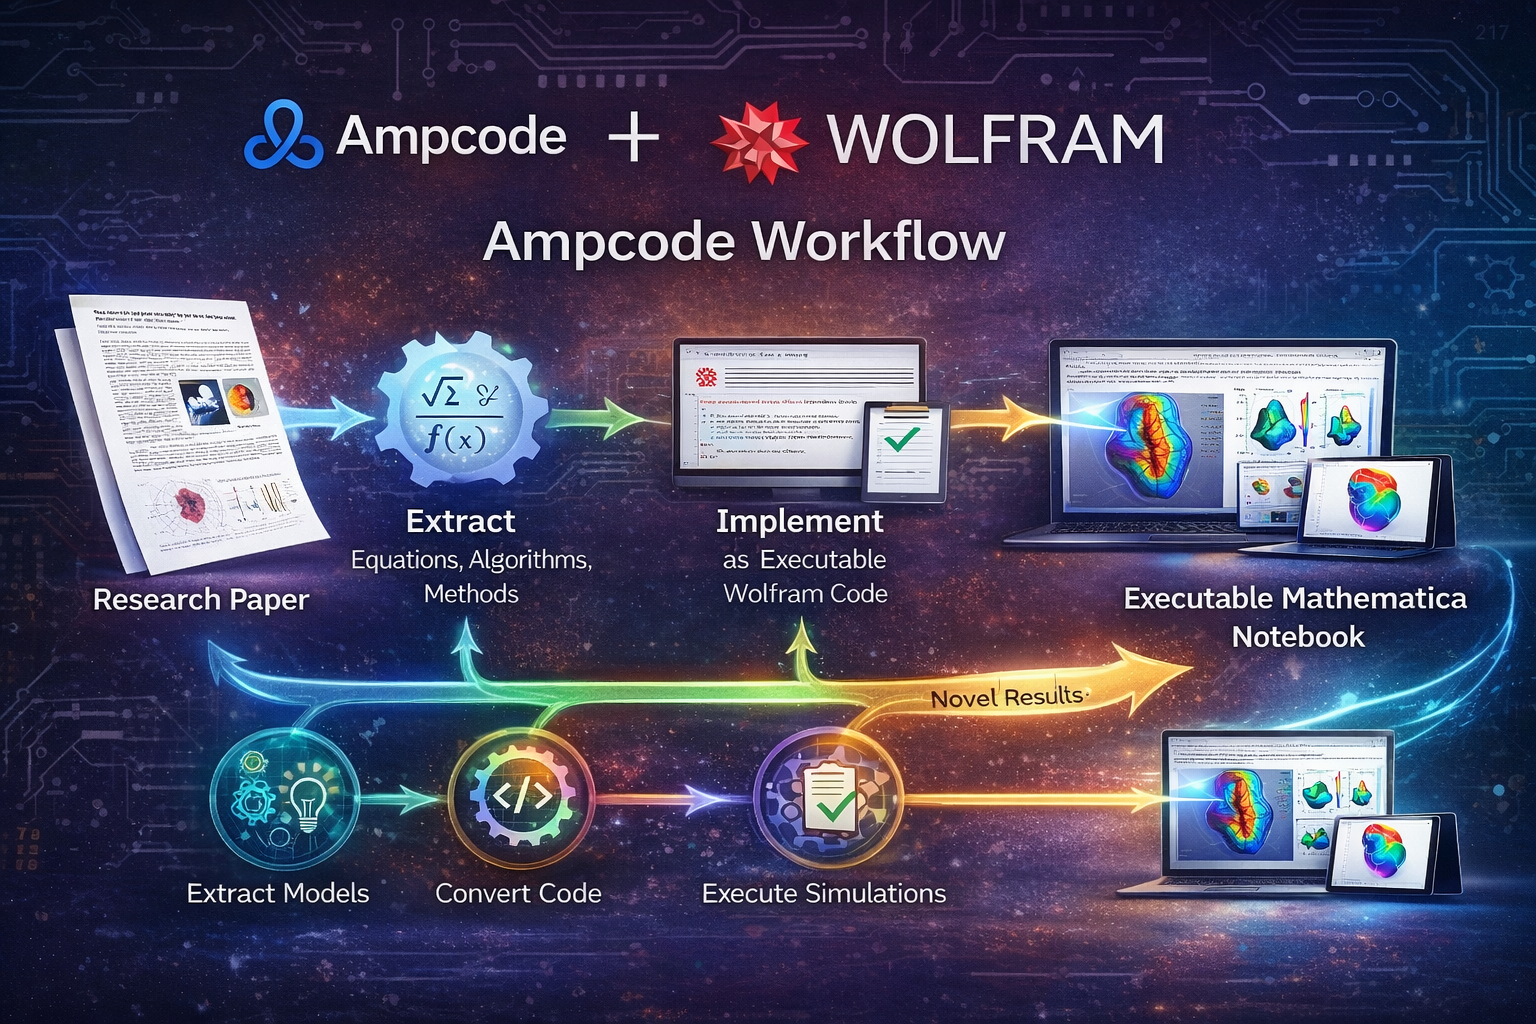
AMP + Wolfram research automation

From paper to executable demo

We used AMP to orchestrate the work and Wolfram Language to turn a clinical paper into notebooks, validations, figures, and a synthetic patient-level simulation demo.

Research PDF → claim ledger Wolfram package Verification scripts Simulation notebook
← Swipe to navigate →

Prepared as an ESL + Wolfram capability demo

Focused on Wolfram notebooks, verification pipelines, reproducible exports, and training/consultancy services around Wolfram products.

The combined process

AMP manages the workflow; Wolfram executes the science

AMP acts like the autonomous engineering layer: read the paper, extract claims, generate code, build notebooks, run checks, and publish artifacts.

Wolfram Language supplies the computational layer: statistics, symbolic/numeric checks, plotting, notebooks, scripts, and Wolfram Cloud-ready assets.

AMP and Wolfram workflow
Wolfram skill workflow

How a research paper becomes a computational project

01

Read

Extract paper title, design, endpoints, figures, tables, claims, and limitations.

02

Model

Encode data and assumptions as Wolfram associations and reusable functions.

03

Notebook

Create an NB interface for exploration, plots, and interactive demos.

04

Verify

Run WLS scripts to rebuild outputs and audit paper-specific claims.

05

Publish

Export figures, CSV/JSON reports, and cloud-ready notebooks for sharing.

The skill requires evidence: generated exports, validation reports, audit scripts, and explicit limitations—not just a conceptual notebook.
Input paper

What we analyzed

Input: C:\Amp_demos\Edwards\1-s2.0-S1936879822013437-main.pdf

Paper: “1-Year Outcomes of Cardioband Tricuspid Valve Reconstruction System Early Feasibility Study.”

Clinical topic: transcatheter tricuspid valve repair using the Edwards Cardioband Tricuspid Valve Reconstruction System.

Key aggregate outcomes extracted

37patients enrolled
29available at 1 year
73%TR ≤ moderate at 1 year
19.0KCCQ point improvement
Connection to Edwards

Why this paper matters for Edwards work

Paper connection

  • The evaluated device is the Cardioband Tricuspid Valve Reconstruction System from Edwards Lifesciences.
  • The study was funded by Edwards Lifesciences.
  • The protocol states the sponsor funded trial activities and performed site selection, data collection/monitoring, and statistical analysis.

People and disclosure note

  • The author list includes many clinical investigators, including Jin Liu, MD, affiliated in the paper with the Cardiovascular Research Foundation.
  • The extracted text does not identify a specific Edwards employee as an author.
  • Several authors disclose consulting, grants, advisory board, or research relationships with Edwards Lifesciences.

For presentation accuracy, we describe Edwards as sponsor/device company and avoid claiming a named Edwards employee unless confirmed by a source outside the PDF.

What we built

NB + WL + WLS architecture

  • .wl package: reusable model, transcribed aggregate data, validation functions, simulation functions, exporters.
  • .nb notebooks: human-facing exploration and synthetic demo interface.
  • .wls scripts: reproducible command-line build and audit pipeline.
  • exports: PNG figures, CSV tables, JSON validation, audit reports.

Repository outputs

CardiobandTRNotebook.nb

CardiobandTRSimulationNotebook.nb

src/CardiobandTRModel.wl

build_project.wls + proof_audit.wls

The build passed with 35 paper-specific audit checks and 0 failures.

Limitation

This was not a full patient-level reanalysis

The PDF contains aggregate tables, figure captions, means, percentages, and event counts. It does not include the raw patient-level measurements, censoring times, or event-time data.

Therefore, exact Kaplan-Meier reconstruction, Wilcoxon signed-rank replication, and patient-level subgroup modeling are not possible from the PDF alone.

What we can validate safely

  • Count-to-percentage consistency.
  • Reported mean changes where summary statistics exist.
  • Internal consistency of headline claims.
  • Transparent limitations and reproducible exports.
Synthetic data demo

Making the demo more interesting without overclaiming

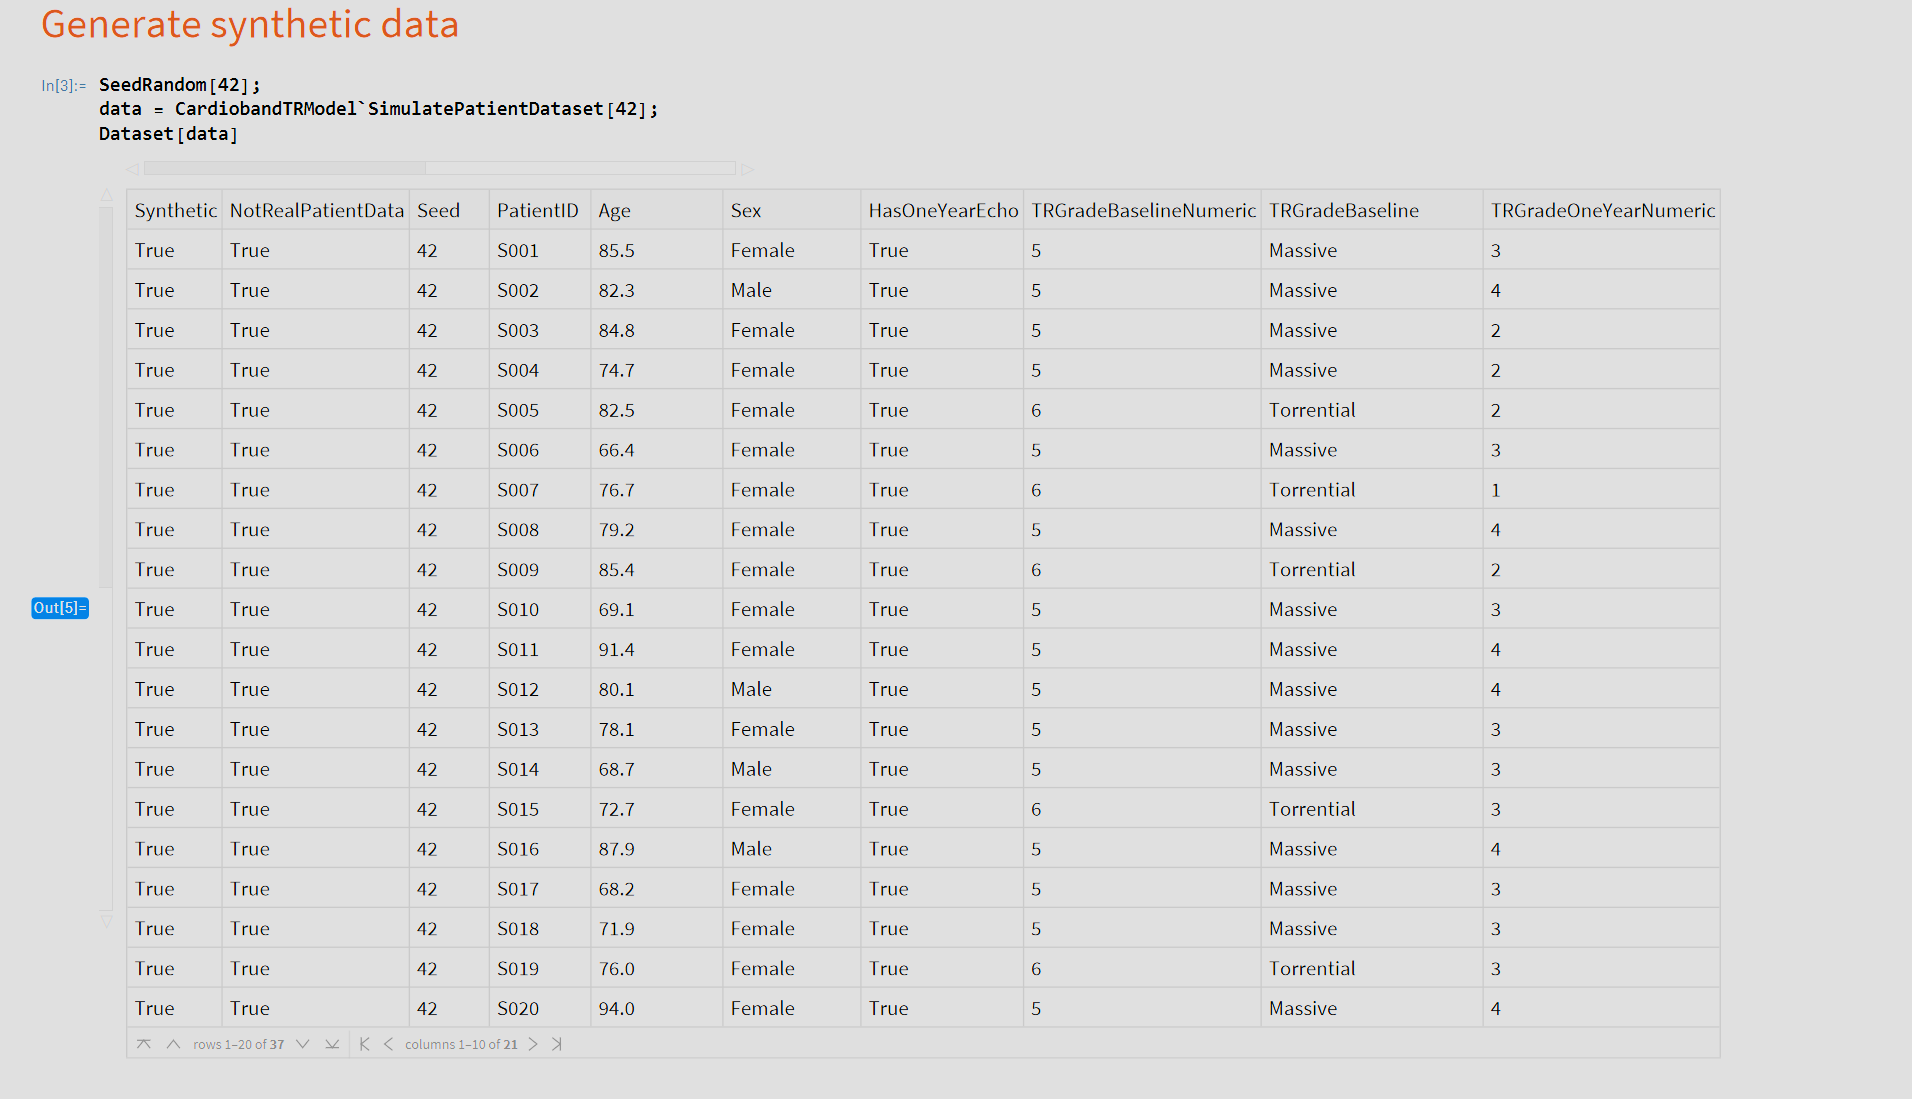
We generated a synthetic patient-level CSV constrained to the paper’s aggregate values. Every row is flagged as synthetic and not real patient data.

This enables interactive scatter plots, response distributions, event curves, and what-if analysis while preserving scientific honesty.

Generated synthetic data table
Simulation check

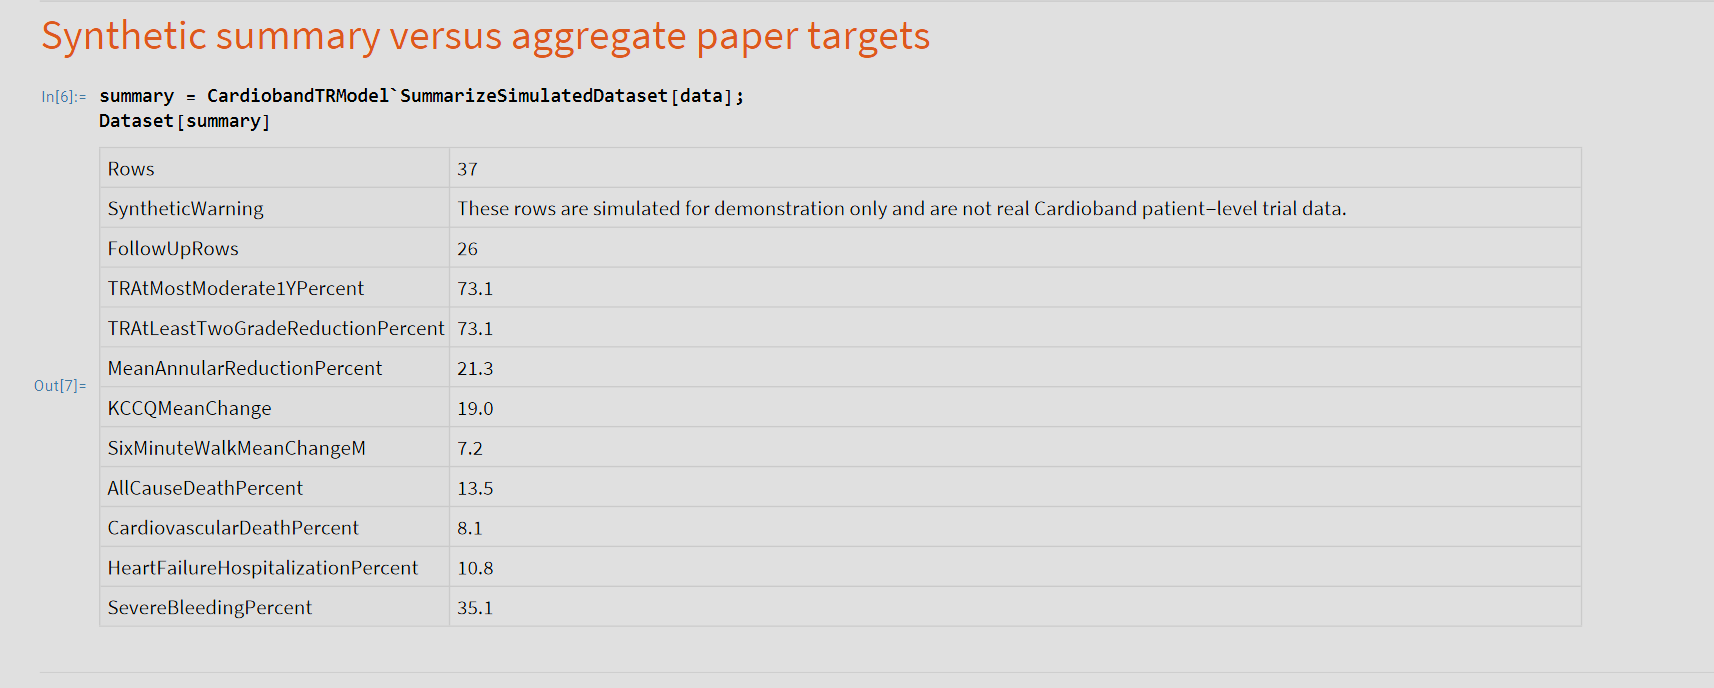
Synthetic summary versus paper targets

The synthetic dataset is tuned to preserve the aggregate story: 37 rows, 26 with follow-up, 73.1% TR ≤ moderate, 21.3% annular reduction, 19-point KCCQ improvement, and matching event percentages.

Synthetic summary versus aggregate paper targets
Result view 1

TR grade shift

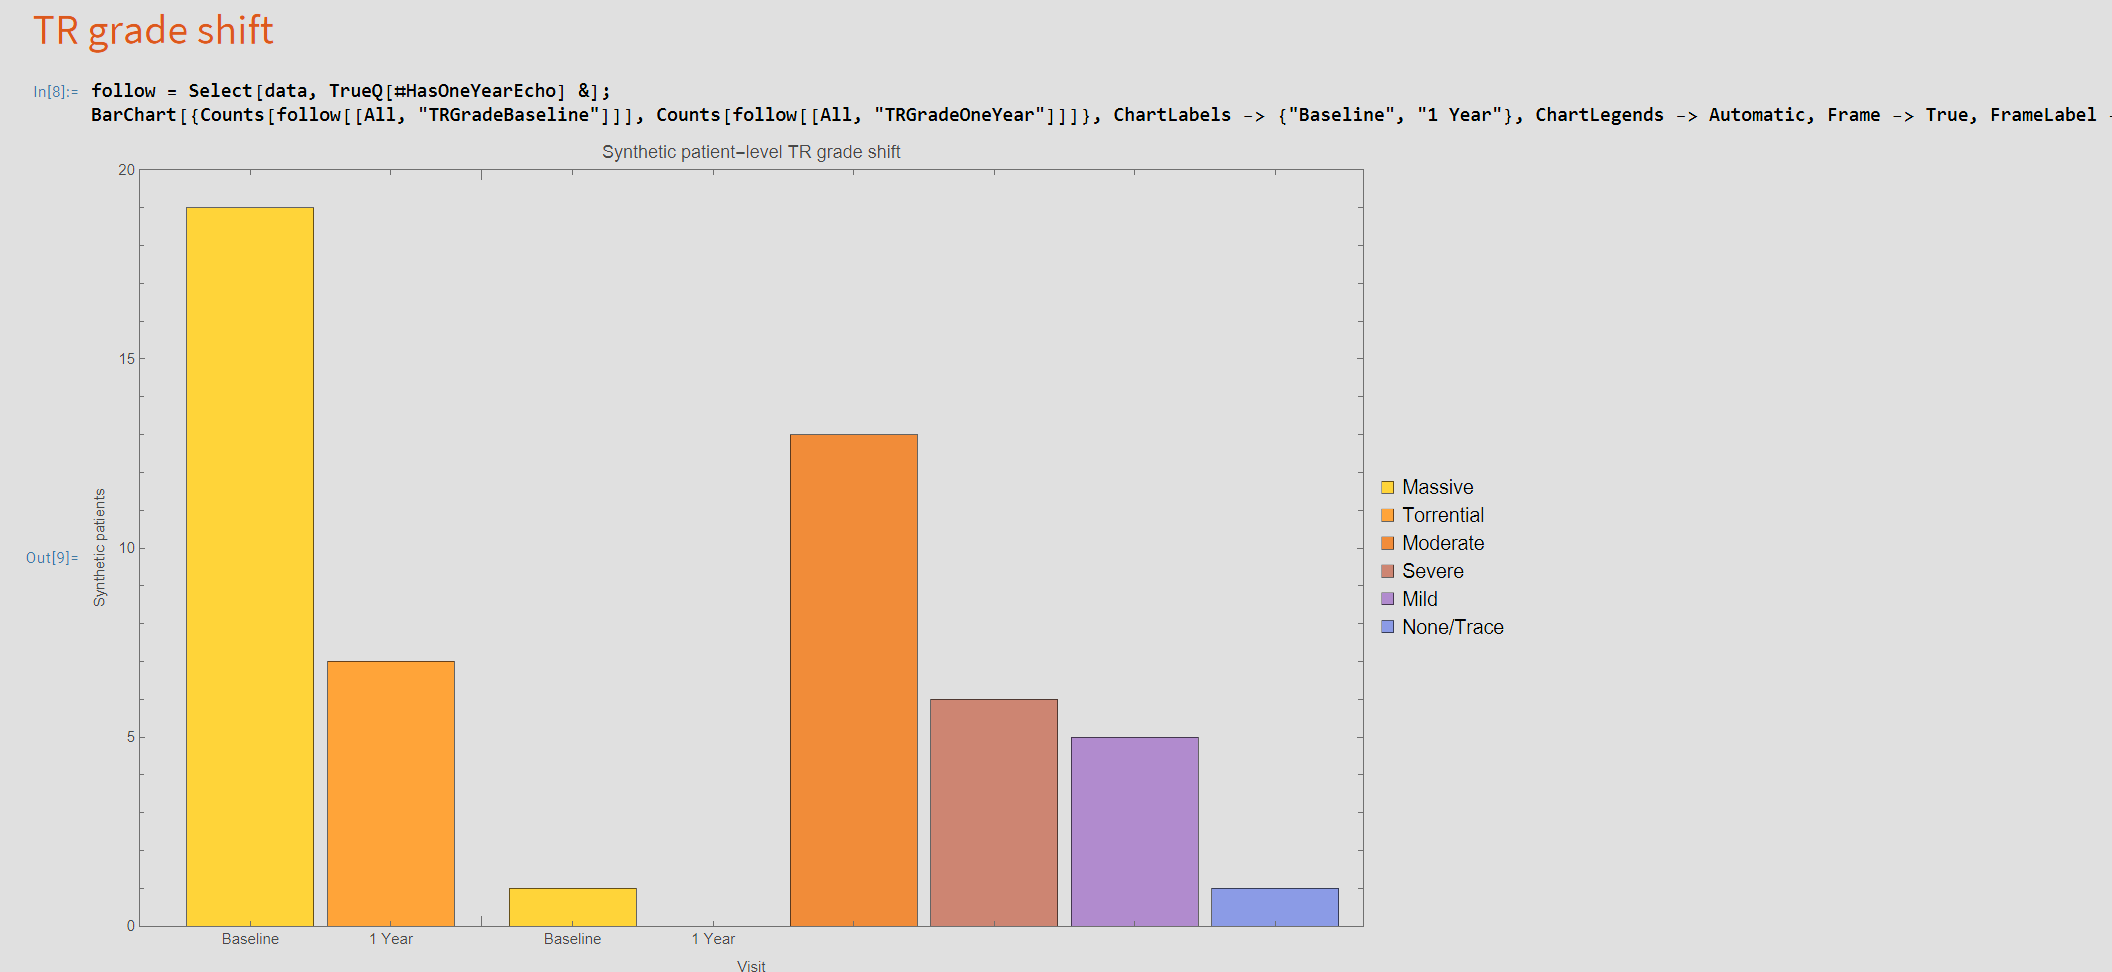
This plot converts the aggregate “TR reduction” claim into an intuitive patient-level demo: baseline disease is concentrated in severe/massive/torrential grades, while the 1-year synthetic distribution shifts toward none/trace, mild, and moderate.

Real-world meaning: this is the clinical story the Cardioband intervention is trying to show—less severe tricuspid regurgitation after annular reduction.

TR grade shift
Result view 2

Paired annular response

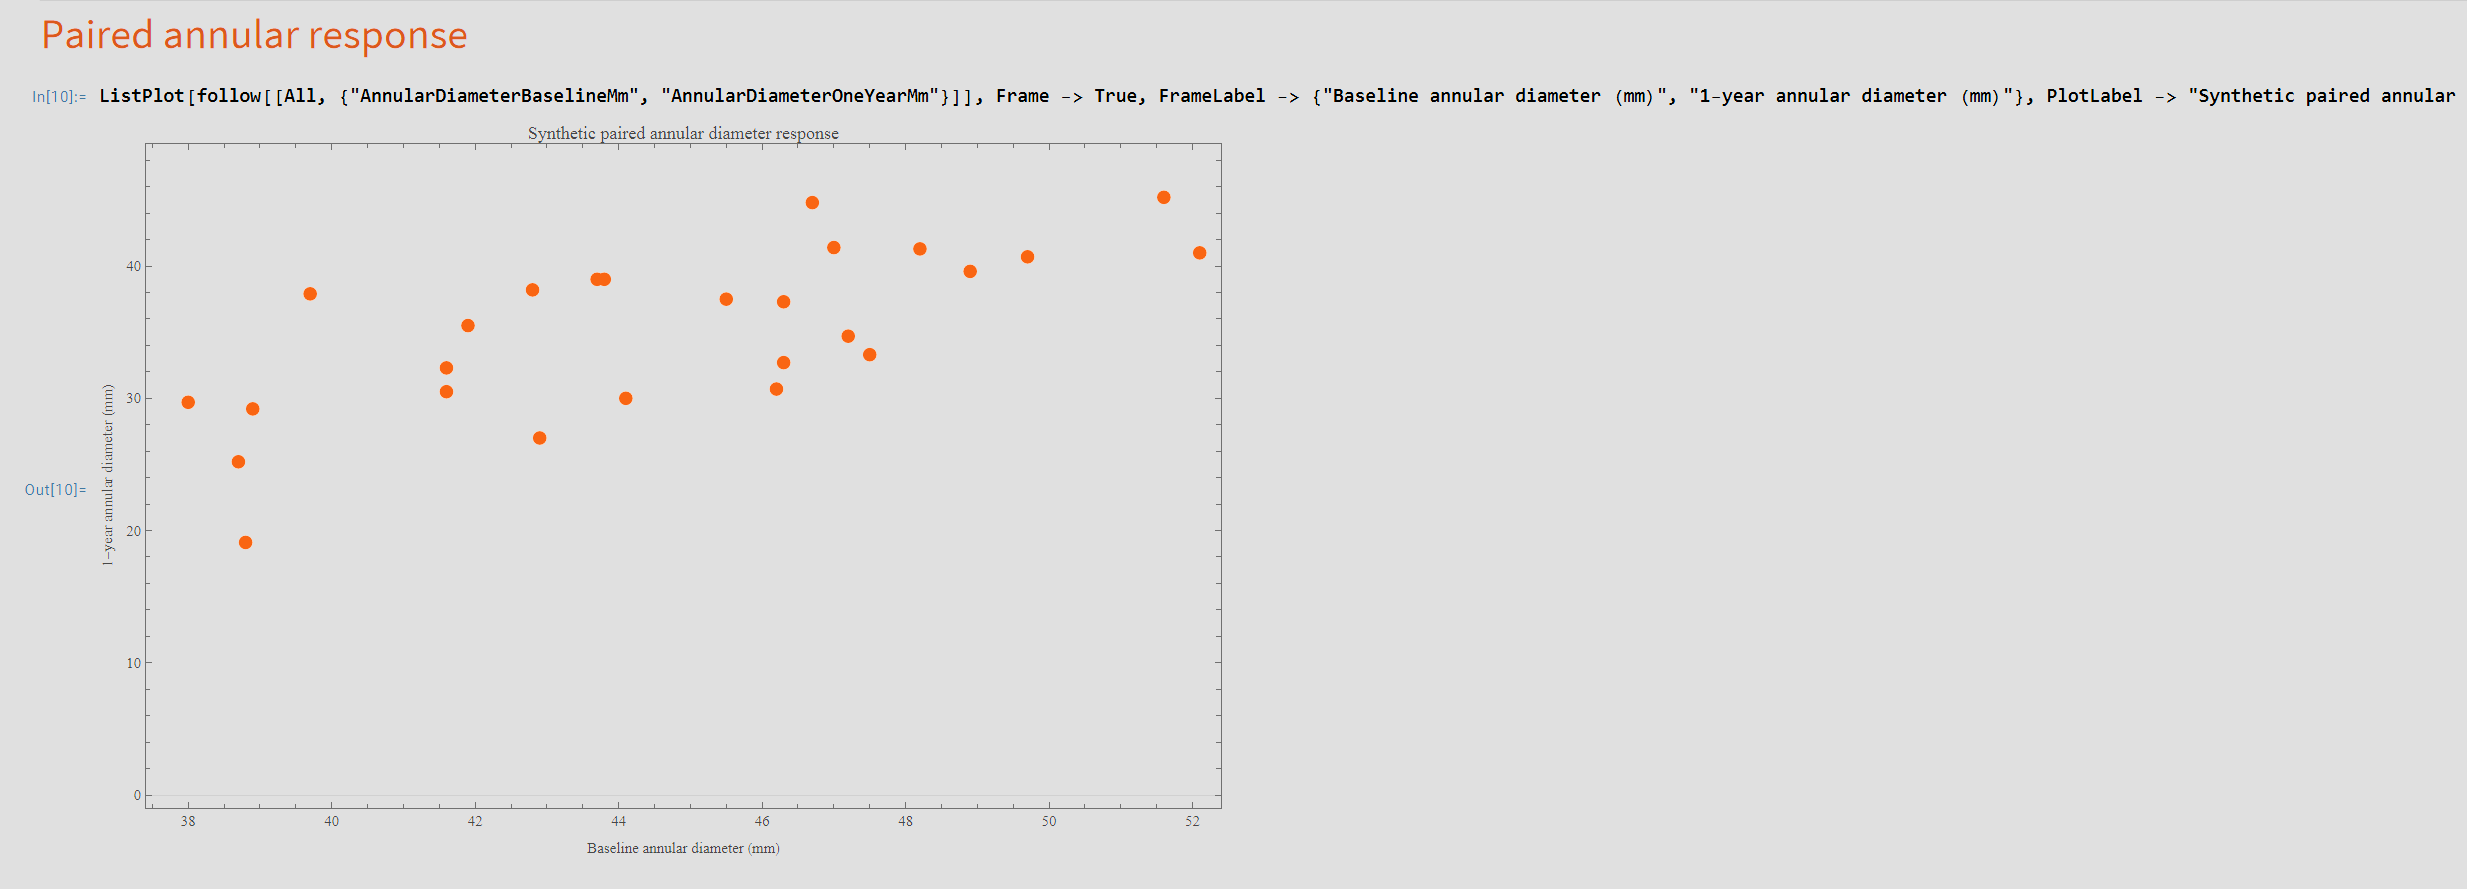
The Cardioband mechanism is annular reduction. The synthetic paired scatter shows each simulated patient’s baseline versus 1-year annular diameter, constrained to the paper’s reported 21.3% mean reduction.

Engineering/clinical bridge: this connects a device mechanism—reshaping the valve annulus—to measurable echocardiographic outcomes.

Paired annular response
Result view 3

KCCQ response

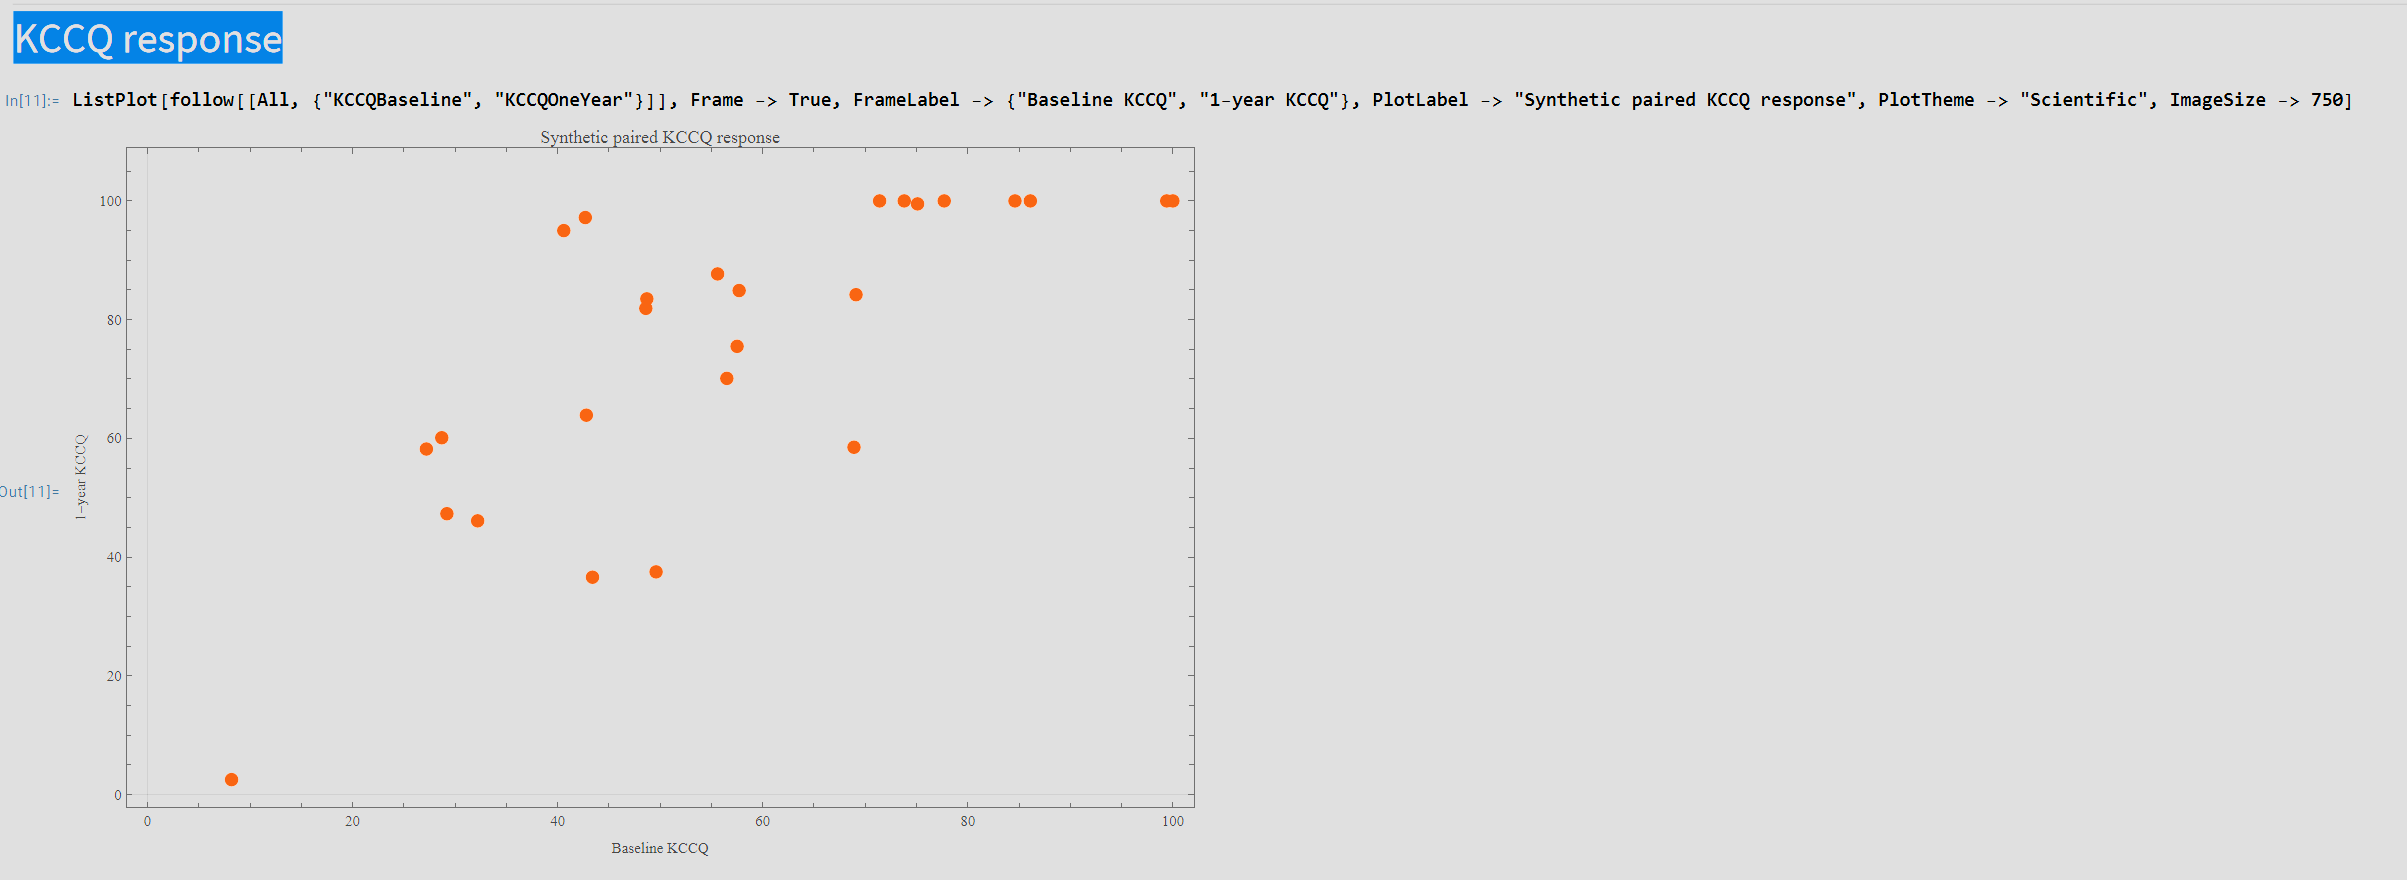
KCCQ is a patient-reported quality-of-life score. The paper reports a 19-point improvement, which is clinically meaningful. The synthetic notebook makes that improvement explorable at a simulated patient level.

Real-world meaning: beyond echo metrics, the workflow highlights whether patients may feel better and function better.

KCCQ response
Interactive demo

What-if scaling of treatment effect

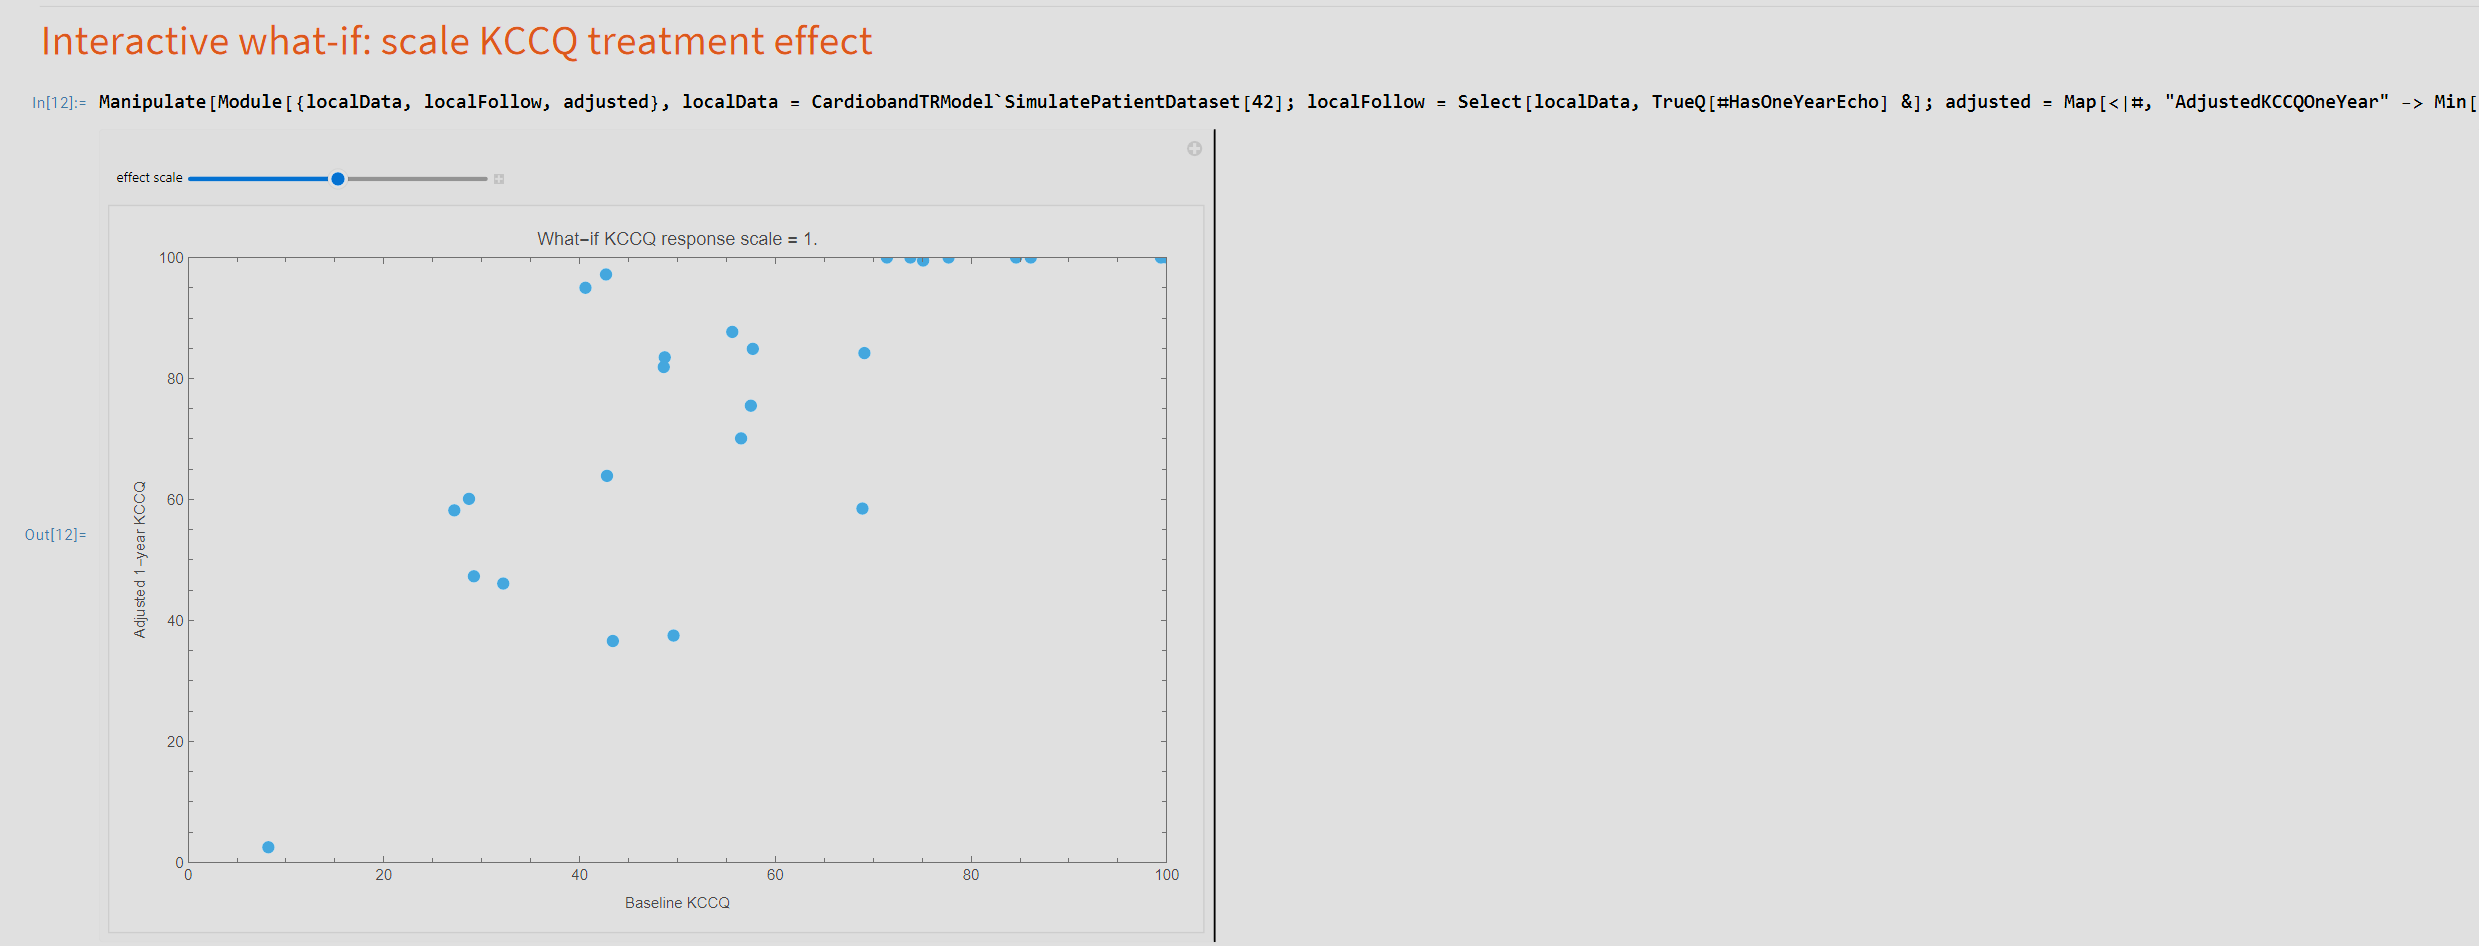
The simulation notebook includes a Wolfram Manipulate control to scale the KCCQ response. This turns a static paper result into an interactive training asset.

Users can ask: what if the response were 25%, 50%, or 75% stronger/weaker?

Interactive what-if KCCQ treatment effect
ESL + Wolfram offering

From one paper demo to repeatable services

Consultancy

Transform technical papers, clinical protocols, and engineering reports into Wolfram packages, notebooks, dashboards, and validation scripts.

Training

Teach teams how to use Wolfram Language, Mathematica notebooks, WolframScript, and Wolfram Cloud for scientific and engineering workflows.

Enablement

As local representatives for Wolfram Research products, ESL can help organizations adopt, prototype, and operationalize Wolfram-based solutions.

The Edwards case study shows a practical path: take a published result, make it executable, document limitations, and build a trustworthy simulation demo.

Takeaway

Executable research is easier to inspect, teach, and extend

  • AMP accelerated the engineering loop from paper to repo.
  • Wolfram provided the notebook, validation, statistics, and visualization environment.
  • Edwards-related clinical evidence became a clear, reproducible, demo-ready workflow.
  • ESL can package this as consulting and training for Wolfram users.

AMP + Wolfram + ESL

Paper → notebook → verification → simulation → cloud-ready demo

1 / 15